Furniture Store Marketing Benchmarks 2026
Mobile Discovery, Search Visibility and Customer Retention Define the New Retail Battlefield
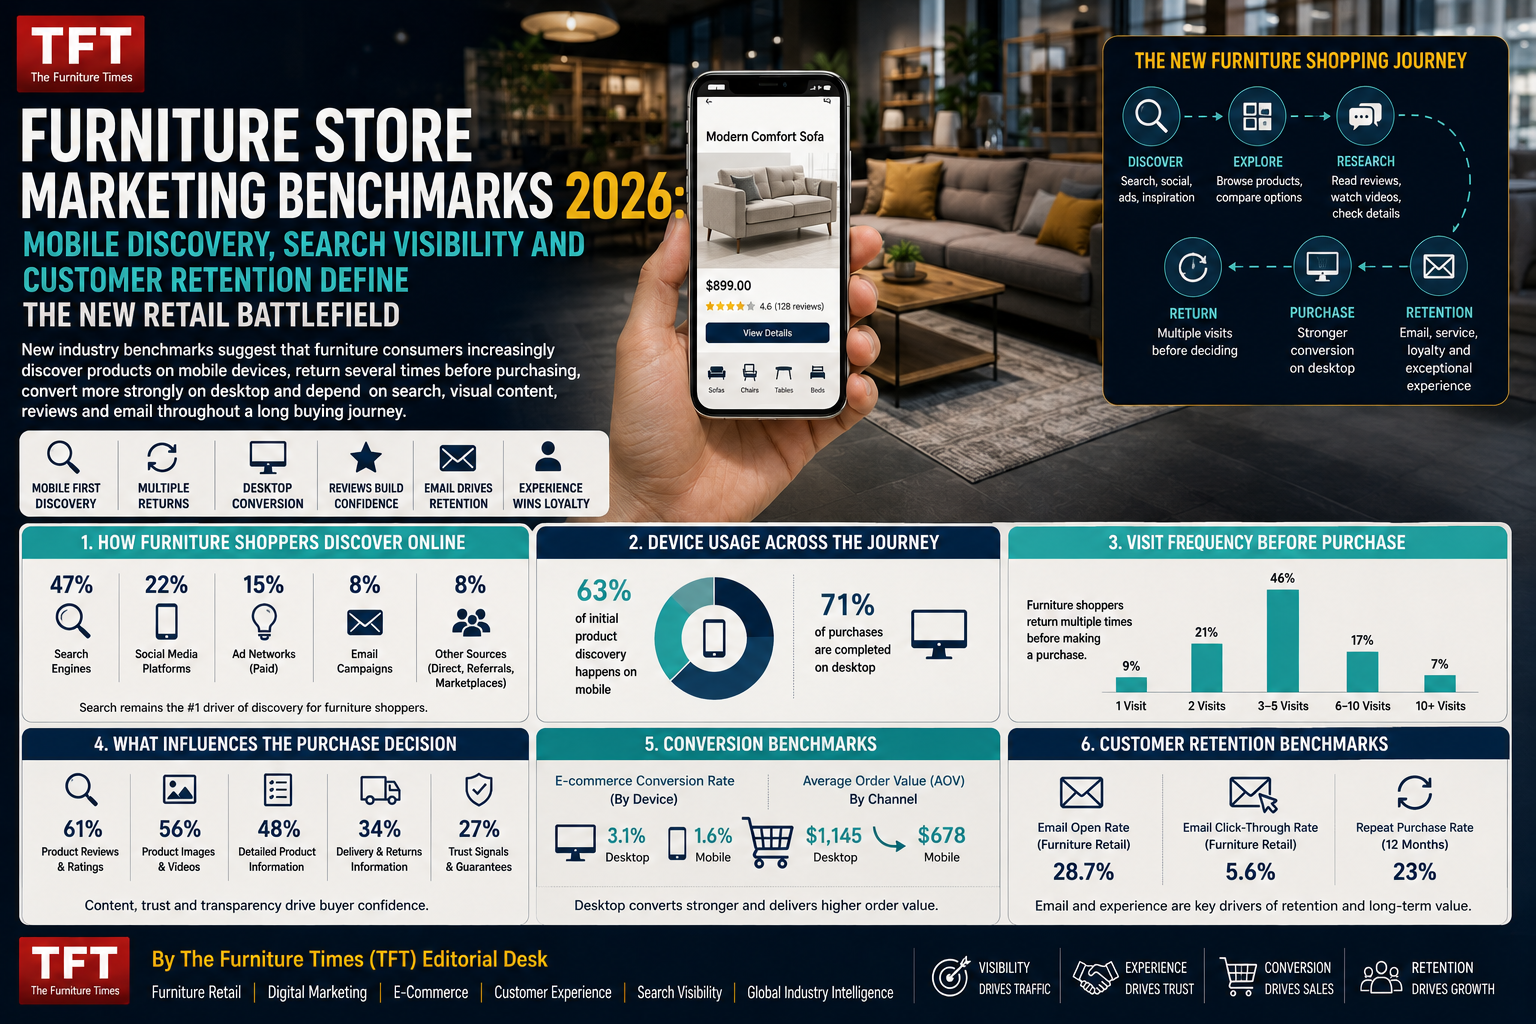
New industry benchmarks suggest that furniture consumers increasingly discover products on mobile devices, return several times before purchasing, convert more strongly on desktop and depend on search, visual content, reviews and email throughout a long buying journey
By The Furniture Times (TFT) Editorial Desk | Furniture Retail | Digital Marketing | E-Commerce | Customer Experience | Search Visibility | Global Industry Intelligence
The digital performance of a furniture store can no longer be measured using the same expectations applied to fashion, groceries, cosmetics or low-cost consumer products.
Furniture purchasing is slower, more visual, more emotional and considerably more complex. Shoppers compare dimensions, materials, colours, room compatibility, delivery charges, warranties, assembly requirements, customer reviews and financing options before they make a decision.
A consumer may discover a sofa through a social-media video, compare alternatives on a mobile phone, revisit the retailer through Google, read reviews on another platform, visit a physical showroom, discuss the purchase with family members and finally complete the transaction on a desktop computer.
This makes furniture retail a long, multi-device and multi-channel customer journey.
A 2026 marketing-benchmark analysis published by CUFinder brings several important metrics together for furniture retailers. The report draws upon late-2025 data and trajectories from sources including Semrush, Similarweb, SaleCycle, WordStream, Klaviyo and Sprout Social, projecting those findings into 2026. It covers device behaviour, traffic sources, paid advertising, website conversion, retention, social engagement and email marketing. CUFinder
The figures reveal a market in which mobile devices dominate discovery, but desktop continues to play a disproportionately important role in transactions. Organic search remains the largest global traffic source, while email automation and cross-device continuity are becoming increasingly important for recovering otherwise lost sales.
The central lesson is not that every furniture store must achieve precisely the same numbers. It is that furniture businesses need benchmarks designed around the realities of furniture buying.
The major furniture-store marketing benchmarks for 2026
The CUFinder analysis provides the following performance reference points:
| Category | Metric | Reported 2026 benchmark |
|---|---|---|
| Device traffic | Mobile | 72.5% |
| Device traffic | Desktop | 24.5% |
| Device traffic | Tablet | 3.0% |
| Device orders | Mobile | 58.0% |
| Device orders | Desktop | 39.0% |
| Website engagement | Pages per session | 4.8 |
| Website engagement | Average time on site | 3 minutes 45 seconds |
| Bounce rate | Overall range | 45%–55% |
| Traffic source | Global organic search | 38.5% |
| Traffic source | Global direct traffic | 34.0% |
| Google Ads | Average cost per click | US$2.55 |
| Google Ads | Conversion rate | 3.2% |
| Google Ads | Cost per acquisition | US$79 |
| Overall PPC | Average cost per acquisition | US$65.50 |
| Repeat purchases | Within 12 months | 18%–22% |
| Website conversion | Global average | 1.65% |
| Website conversion | US average | 1.85% |
| Website conversion | Top 20% of performers | 3.10% |
| Mobile conversion | Average | 1.10% |
| Desktop conversion | Average | 2.40% |
| Open rate | 39.5% | |
| Click-through rate | 2.1% | |
| Abandoned cart | Conversion rate | 3.5% |
These figures should be treated as directional benchmarks rather than universal guarantees. Product price, geography, retail format, attribution method, brand maturity, seasonality and measurement settings can produce very different results.
Nevertheless, the benchmarks offer a valuable framework for understanding where furniture retailers are winning and where digital revenue is being lost.
Mobile dominates furniture discovery
The most significant figure in the report is the share of furniture-store traffic attributed to mobile devices.
Mobile reportedly generates 72.5% of visits, compared with 24.5% from desktop computers and 3% from tablets. However, mobile accounts for only 58% of orders, while desktop generates 39% of orders despite representing less than one-quarter of traffic.
This gap exposes one of the furniture industry’s most important digital challenges.
Consumers are comfortable browsing furniture on their phones, but many still hesitate to complete expensive purchases on a small screen.
They may use mobile devices to:
- Discover new furniture brands
- Browse room inspiration
- Compare colours and styles
- Save products
- Watch product videos
- Read reviews
- Check store locations
- Send products to family members
- Ask questions through WhatsApp or live chat
- Compare prices while visiting a showroom
When the shopper becomes ready to evaluate technical information or enter payment and delivery details, the journey may move to desktop.
This is not necessarily a failure of mobile commerce. It reflects the complexity of the furniture decision. However, retailers should still ask why such a large share of mobile visitors does not complete the transaction on the same device.
The cost of a poor mobile experience
Furniture websites are unusually demanding because they depend on high-resolution photography, lifestyle images, videos, colour swatches, configuration tools, zoom functions, reviews and delivery information.
If these assets are poorly optimised, the mobile experience becomes slow and frustrating.
Common mobile problems include:
- Oversized images
- Slow-loading galleries
- Pop-ups covering the screen
- Difficult navigation
- Filters that are hard to use
- Small colour swatches
- Hidden delivery charges
- Unclear product availability
- Complicated account creation
- Lengthy checkout forms
- Payment options appearing too late
- Product configurators that do not work properly
- Chats or promotional banners blocking buttons
According to CUFinder’s compilation, the average furniture-site bounce rate sits between 45% and 55%. Mobile bounce rates are estimated at approximately 58%, compared with around 38% on desktop.
The difference suggests that many furniture retailers are losing potential customers before the product has received proper consideration.
The solution is not to remove useful content. It is to make that content faster, clearer and easier to navigate.
Mobile must support discovery—and preserve the journey
A consumer who starts on mobile and later moves to desktop should not be forced to begin again.
Retailers should provide:
- Persistent shopping carts
- Wish lists
- Saved room plans
- Recently viewed products
- Saved configurations
- Email-to-yourself options
- Shareable product links
- Account-independent cart recovery
- Consistent inventory information
- Smooth movement between app, mobile website and desktop
Cross-device continuity is particularly important for configurable furniture. If a shopper selects the size, orientation, fabric and colour of a sectional sofa on mobile, those selections should still exist when the person returns on a laptop.
Furniture shoppers need time to make decisions
The report estimates that an average furniture visitor views 4.8 pages per session and spends approximately three minutes and 45 seconds on the website.
This level of engagement reflects a category in which consumers usually need more information than they require when buying a routine household item.
A shopper may compare:
- Two-seat and three-seat sofas
- Left- and right-hand configurations
- Different materials
- Multiple finish options
- Dimensions
- Seating comfort
- Available stock
- Delivery schedules
- Assembly services
- Financing plans
- Warranty conditions
- Customer photographs and reviews
Retailers should not automatically interpret a delayed conversion as lost interest. A customer returning repeatedly may be moving closer to purchase.
The report identifies a typical visitor mix of approximately 60% new users and 40% returning users for established furniture e-commerce businesses. A healthy returning-visitor rate can indicate that prospective customers are researching and comparing before making a commitment.
Why standard last-click attribution misreads furniture demand
A furniture purchase can be influenced by several contacts:
- An Instagram Reel creates awareness.
- Google search brings the shopper to the website.
- A product page generates interest.
- A review platform reduces uncertainty.
- A showroom visit confirms comfort.
- An email provides a promotion.
- A branded search leads to the final transaction.
If the sale is credited only to the final Google search or email click, the retailer may wrongly conclude that the earlier channels produced no value.
This can lead to damaging budget decisions. A company may stop investing in content, social media or public relations because those activities did not receive last-click credit—even though they created the awareness that made the final search possible.
Furniture retailers should consider longer attribution windows and review assisted conversions, branded-search growth, returning visitors, saved products, showroom visits, quotation requests and telephone enquiries.
Organic search remains the largest global traffic source
CUFinder’s compiled benchmark estimates that organic search generates 38.5% of global furniture-store website traffic.
The reported global channel mix is:
| Traffic source | Estimated global share |
|---|---|
| Organic search | 38.5% |
| Direct traffic | 34.0% |
| Paid search | 12.5% |
| Social media | 8.0% |
| Email and referrals | 7.0% |
This data reinforces the strategic importance of search visibility.
Furniture consumers do not search only for brand names. They search by product, material, room, style, size, problem, budget and location.
Examples may include:
- Solid wood dining table
- Outdoor sofa for small balcony
- Hotel furniture supplier
- Ergonomic office chair
- Furniture store near me
- Dining table for eight people
- Weather-resistant garden furniture
- Best sofa for pets
- Teak furniture Malaysia
- Custom wardrobe manufacturer
- Restaurant furniture supplier
- Sustainable bedroom furniture
- Commercial outdoor furniture
- Small-space storage solutions
A retailer that appears only when customers search its exact brand name is visible too late in the journey. It must also be discoverable while consumers are defining what they want.
Search visibility requires more than product pages
A strong furniture-search strategy should include:
- Detailed category pages
- Useful product descriptions
- Material guides
- Dimension information
- Room-planning advice
- Care and maintenance content
- Buying guides
- Delivery-area pages
- Local showroom information
- Commercial-project pages
- Customer reviews
- Frequently asked questions
- Comparison content
- Structured product data
- Image optimisation
- Accurate availability and pricing
Generic descriptions supplied by manufacturers and repeated across many retailer websites offer limited differentiation.
A product page should answer the questions that prevent a customer from buying.
Direct traffic shows the value of brand memory
Direct traffic is estimated to contribute 34% of global furniture-store visits.
Direct traffic can include consumers who type a web address, use a bookmark or arrive through channels that analytics systems cannot identify fully. It can also reflect brand familiarity developed through advertising, physical stores, word of mouth, news coverage, exhibitions, delivery vehicles or offline marketing.
The high direct-traffic share demonstrates that brand-building activity can create measurable demand even when it does not receive direct conversion credit.
A consumer cannot search for a furniture brand whose name has never entered their awareness.
This is why furniture retailers should not choose between performance marketing and brand building. They need both.
Performance activity captures existing intent. Brand activity helps create future intent.
The United States depends more heavily on paid traffic
The CUFinder report estimates the following channel mix for US furniture retailers:
| Traffic source | Estimated US share |
|---|---|
| Organic search | 35.0% |
| Direct traffic | 32.0% |
| Paid search | 18.0% |
| Social media | 9.0% |
| Email and referrals | 6.0% |
Paid search contributes an estimated 18% of US traffic—5.5 percentage points above the global benchmark.
This reflects an intensely competitive market in which national chains, regional retailers, direct-to-consumer brands, marketplaces and local stores compete for high-intent searches.
Paid advertising can give furniture companies immediate visibility, but excessive dependency creates risk. Once the budget stops, much of the traffic may disappear.
A balanced retailer should develop paid acquisition while building organic search authority, brand demand, email audiences and customer-review strength.
Google Ads: high intent comes at a price
CUFinder’s 2026 benchmarks for furniture-related Google Ads include:
- Click-through rate: 4.5%
- Average cost per click: US$2.55
- Conversion rate: 3.2%
- Cost per acquisition: US$79
Search advertising can be effective because it reaches consumers who are actively expressing intent.
Someone searching “buy modular sofa with delivery” is usually closer to purchasing than a person passively viewing a room-inspiration video.
However, retailers should not judge advertising using cost per click alone. The more important questions are:
- What is the gross margin on the sale?
- How many orders are cancelled?
- What is the delivery cost?
- What is the return rate?
- Does the customer purchase accessories later?
- Does the campaign generate showroom visits?
- Are telephone and WhatsApp enquiries tracked?
- Are sales credited across devices?
- Are low-margin products absorbing the budget?
A US$79 acquisition cost may be commercially attractive for a high-margin sofa but unsustainable for a low-priced accessory.
Landing-page problems are often mistaken for advertising problems
When an advertising campaign produces clicks but few orders, retailers often blame keyword targeting or bidding.
The real problem may be the website.
A high-intent shopper may abandon a landing page because:
- The advertised product is unavailable
- The price has changed
- Delivery charges are hidden
- The lead time is unclear
- The photographs are inadequate
- Dimensions are difficult to find
- Reviews are missing
- The mobile page is slow
- The return policy is uncertain
- The product cannot be configured easily
Increasing the advertising budget will not repair a weak buying experience.
Facebook and Instagram influence the upper funnel
The benchmark figures presented for Facebook advertising include:
- Click-through rate: 1.40%
- Cost per click: US$0.95
- Conversion rate: 1.8%
- Cost per acquisition: US$52
These numbers should not be compared with Google Ads without considering user intent.
Google often captures expressed demand. Facebook and Instagram frequently introduce the idea.
A person may not open Instagram intending to buy a dining set. However, a well-designed room, transformation video or customer-home feature can create interest.
Visual advertising is particularly effective for:
- New collection launches
- Room transformations
- Before-and-after content
- Seasonal campaigns
- Outdoor-living inspiration
- Interior-design ideas
- Small-space solutions
- Customer homes
- Factory craftsmanship
- Designer collaborations
- Retargeting
If a company evaluates Facebook only according to immediate transactions, it may undervalue the platform’s role in generating awareness and remarketing audiences.
Google Shopping depends on product-data quality
The report provides the following Google Shopping benchmarks:
- Click-through rate: 0.85%
- Cost per click: US$0.70
- Conversion rate: 2.1%
Shopping ads are highly visual and place price, image and product information directly within the search experience.
Performance depends heavily on the accuracy of the product feed.
Furniture retailers need consistent:
- Product names
- Brand information
- Prices
- Availability
- Images
- Colours
- Materials
- Dimensions
- Variant identifiers
- Delivery information
- Product categories
Poor data can cause product rejection, weak relevance or disappointing customer experiences.
This is part of the furniture industry’s wider data problem. If retailers, manufacturers and marketplaces describe the same product differently, discovery becomes more difficult for both conventional search engines and AI-driven platforms.
Average furniture conversion remains below general e-commerce
The CUFinder analysis places the global furniture-store conversion rate at approximately 1.65%, with the US average at 1.85%.
The top-performing 20% reportedly reach approximately 3.10%.
| Segment | Reported conversion rate |
|---|---|
| Global furniture-store average | 1.65% |
| US furniture-store average | 1.85% |
| Top 20% of performers | 3.10% |
| Mobile | 1.10% |
| Desktop | 2.40% |
A lower conversion rate than general e-commerce is not surprising. Furniture involves higher prices, longer ownership periods, delivery complexity and considerable perceived risk.
However, the difference between the average rate and the top-performing benchmark is substantial.
If two furniture stores each attract 100,000 visits, the difference between converting 1.65% and 3.10% can represent approximately 1,450 additional orders—before adjusting for cancellations, attribution, lead-based transactions or offline purchases.
What separates stronger converters?
The report highlights faster mobile pages, streamlined checkout and cross-device cart persistence. The wider industry experience suggests several additional factors:
- High-quality room photography
- Accurate dimensions
- Product videos
- Fabric and finish samples
- Customer reviews
- Delivery-date clarity
- Visible stock status
- Financing
- Trust signals
- Easy returns
- Live assistance
- AR or room visualisation
- Transparent warranties
- Clear assembly information
- Local showroom availability
Furniture conversion is fundamentally a question of uncertainty reduction.
The retailer that answers more questions and removes more risk is likely to convert more visitors.
Customer retention has a different meaning in furniture
The reported 12-month repeat-purchase benchmark is between 18% and 22%.
Furniture retailers should not compare this directly with businesses selling frequently replenished products. Customers do not normally buy beds, wardrobes or sofas every month.
Retention in furniture can mean helping a customer complete a room over time.
A sofa purchaser may later need:
- Side tables
- Lamps
- Rugs
- Cushions
- Outdoor furniture
- Dining chairs
- Storage
- Bedroom furniture
- Replacement covers
- Care products
- Spare components
This creates an opportunity for retailers with complementary categories.
The report estimates that loyalty-program participation averages approximately 12% of the customer base. Although this appears modest, the value of each retained furniture customer can be substantial due to high transaction values.
Retention should start before delivery
Furniture businesses sometimes treat retention as a promotion sent months after the sale. In reality, retention begins immediately.
The customer’s willingness to return depends on:
- Accurate delivery promises
- Proactive communication
- Professional installation
- Damage-free products
- Quick problem resolution
- Accessible warranty service
- Replacement-part availability
- Honest product descriptions
Marketing cannot compensate indefinitely for unreliable delivery or poor after-sales service.
Customer experience is marketing.
Email remains one of furniture retail’s strongest owned channels
CUFinder reports an average furniture-industry email open rate of 39.5%, a click-through rate of 2.1%, an unsubscribe rate of 0.25% and a bounce rate of 0.40%.
Automated email flows reportedly perform more strongly:
| Automated flow | Reported benchmark |
|---|---|
| Welcome-series open rate | 55% |
| Abandoned-cart open rate | 48% |
| Abandoned-cart conversion rate | 3.5% |
Open-rate figures should be interpreted cautiously because privacy protections—particularly Apple Mail Privacy Protection—can inflate recorded opens. Clicks, conversions, revenue per recipient and assisted sales often provide more reliable evidence of engagement.
Nevertheless, email offers an important advantage: the retailer controls the customer relationship instead of renting access through an advertising platform.
Furniture retailers need lifecycle emails
Effective automated programmes can include:
- Welcome series
- Browse-abandonment reminders
- Cart-recovery messages
- Back-in-stock notifications
- Price-drop alerts
- Fabric-sample follow-ups
- Quotation reminders
- Delivery updates
- Care instructions
- Review requests
- Warranty-registration reminders
- Complementary-product recommendations
- Replacement-part messages
- Anniversary and room-refresh campaigns
Because furniture decisions can take weeks, an abandoned cart does not always indicate rejection. It may indicate that the shopper is still measuring a room, consulting family members, comparing finance options or waiting for a move.
The recovery message should reduce uncertainty, not merely repeat “You left something behind.”
TikTok leads reported social engagement
The social benchmarks cited in the report are:
| Platform | Reported engagement benchmark |
|---|---|
| TikTok | 3.80% |
| 1.20% save rate | |
| 0.95% | |
| 0.15% |
TikTok’s estimated 3.80% engagement reflects the power of transformation-led and educational video.
Furniture performs well when people can see:
- A room before and after furnishing
- A sofa being configured
- A dining table extending
- A recliner mechanism working
- A small balcony being transformed
- Furniture being manufactured
- An artisan completing a piece
- A delivery and installation
- Material comparisons
- Cleaning demonstrations
- A real customer’s home
Static catalogue images still have a role, but video explains scale, movement, comfort and use more effectively.
Pinterest operates as visual search
Pinterest should not be viewed only as a social platform. Many consumers use it to plan homes, renovations, weddings, offices, restaurants and hospitality projects.
The report recommends more than 10 Pins per week for active furniture brands.
Pinterest content can have a longer discovery life than conventional social posts because it remains connected to visual search, themed boards and planning behaviour.
Retailers should link Pins to useful destination pages instead of sending every visitor to the home page.
Reviews are missing from many benchmark dashboards
Although the CUFinder report focuses on marketing channels, customer reviews deserve a central place in any furniture-performance dashboard.
Furniture carries significant perceived risk. A shopper wants to know:
- Is the product comfortable?
- Does the colour match the image?
- Was delivery on time?
- Was the item damaged?
- Did the retailer respond?
- Was assembly difficult?
- Did the sofa sag?
- Did the outdoor furniture weather well?
- Did the company honour the warranty?
Reviews influence conversion, branded search, local visibility and customer confidence.
Businesses should monitor more than star ratings. They should identify recurring themes in customer feedback and connect them with product development, packaging, logistics and service operations.
This is where FurniReviewology can become strategically important: not simply as a rating layer, but as an industry trust and accountability infrastructure.
Benchmarks must be interpreted carefully
The CUFinder figures are useful, but retailers should understand their limitations.
The page describes the benchmarks as a synthesis of multiple external reports and 2025 trajectories projected into 2026. It does not present them as the output of one controlled, audited dataset covering every furniture retailer worldwide.
Several factors can produce different results:
- Market and currency
- Luxury versus mass-market positioning
- Pure e-commerce versus omnichannel retail
- Residential versus commercial furniture
- Brand maturity
- Product category
- Average order value
- Attribution settings
- Cookie-consent rules
- Analytics configuration
- Seasonal promotions
- Delivery areas
- Financing availability
- Website speed
- New versus returning customers
A luxury furniture brand may have a low website conversion rate but generate high-value showroom appointments. A commercial supplier may receive quotation requests instead of online orders. A local retailer may drive telephone calls and WhatsApp enquiries that analytics systems do not recognise as conversions.
The correct approach is to use industry benchmarks as diagnostic reference points—not as rigid targets.
A practical scorecard for furniture retailers
Every furniture business should build its own measurement system around commercial outcomes.
Visibility metrics
- Organic search traffic
- Non-branded keyword visibility
- Branded search volume
- Local search actions
- FISE listing views
- Referral traffic
- AI-search visibility
Engagement metrics
- Product-page views
- Pages per session
- Returning visitors
- Product-video engagement
- Saved products
- Fabric-sample requests
- Room-planner usage
Conversion metrics
- Online transactions
- Quotation requests
- Showroom appointments
- Calls
- WhatsApp enquiries
- Add-to-cart rate
- Checkout completion
- Mobile and desktop conversion
Commercial metrics
- Customer-acquisition cost
- Gross margin after advertising
- Average order value
- Delivery cost
- Cancellation rate
- Return rate
- Revenue per visitor
- Revenue per marketing channel
Retention and trust metrics
- Repeat purchases
- Review rate
- Average customer rating
- Complaint resolution time
- Warranty claims
- Referral sales
- Email engagement
- Customer lifetime value
What furniture retailers should do now
1. Audit the mobile journey
Test every major task on a real mobile device: search, filtering, product configuration, cart, payment, delivery selection and customer support.
2. Protect organic visibility
Build category authority through detailed product information, buying guides, local pages, reviews and structured data.
3. Synchronise mobile and desktop
Preserve carts, wish lists, recently viewed products and configurations across devices.
4. Improve product data
Standardise dimensions, materials, colours, stock, pricing, delivery information and variant identifiers.
5. Measure the full customer journey
Connect digital advertising with calls, WhatsApp conversations, showroom appointments, quotations and offline transactions.
6. Develop visual storytelling
Use room transformations, demonstrations, customer homes, craftsmanship and educational videos.
7. Build automated email journeys
Welcome, browse recovery, cart recovery, quotation follow-up, post-purchase care and review requests should operate consistently.
8. Strengthen reviews
Request verified feedback, respond professionally and use recurring complaints as product intelligence.
9. Reduce purchase uncertainty
Make delivery dates, warranty terms, product dimensions, material details and return conditions easy to find.
10. Benchmark against your own progress
Compare current performance with the previous quarter and year—not only with an external industry average.
TFT analysis: visibility, discovery and trust are converging
The 2026 benchmarks reveal something larger than a collection of marketing statistics.
Furniture retail is becoming an interconnected discovery system.
A customer may encounter a business through a news article, find its products through search, verify its reputation through reviews and complete the transaction across several devices.
No single channel controls the whole journey.
This is why the future of furniture commerce requires three connected layers:
The Furniture Times tells their story.
Furniture Industry Search Engine helps the world find them.
FurniReviewology helps the world trust them.
Within the $1 trillion furniture industry ecosystem, retailers can no longer rely only on location, inventory or advertising budgets. They must become searchable, understandable, responsive and trusted.
The furniture companies that master these four capabilities will not merely attract more traffic. They will convert attention into relationships and relationships into long-term commercial value.
Be the next one. Be part of the movement.